1
Derivatives Rollover Report |May 28, 2021
For Private Circulation Only
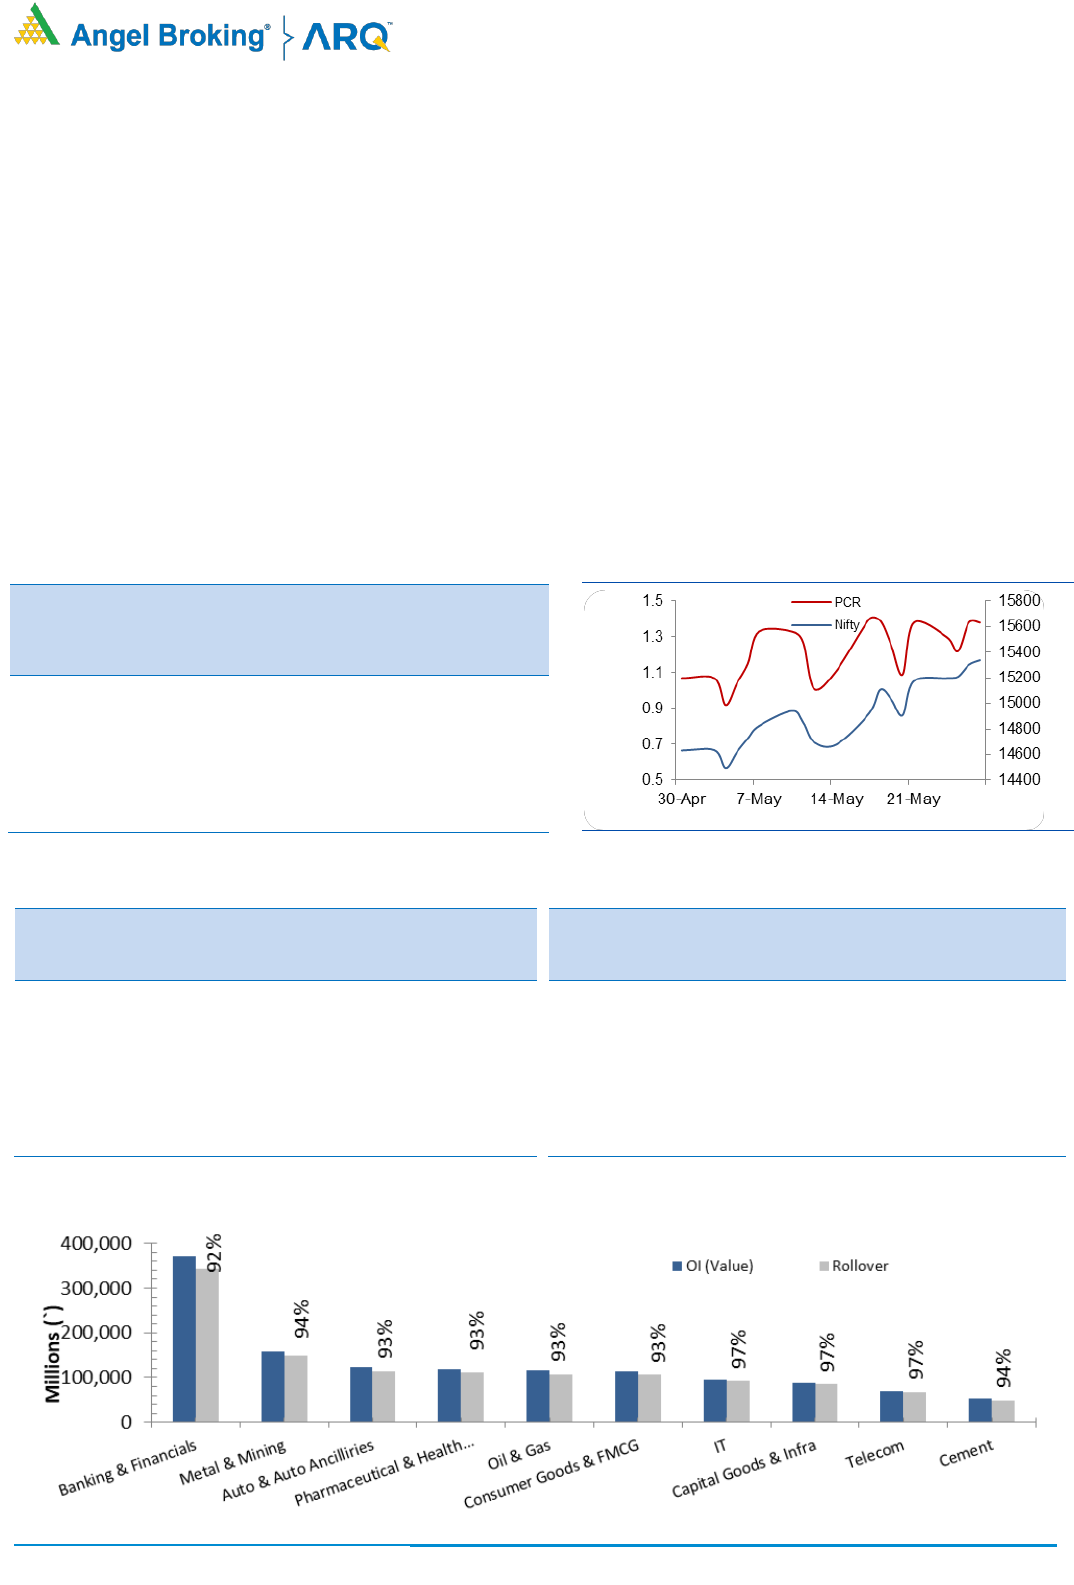
NIFTY & PCR Graph
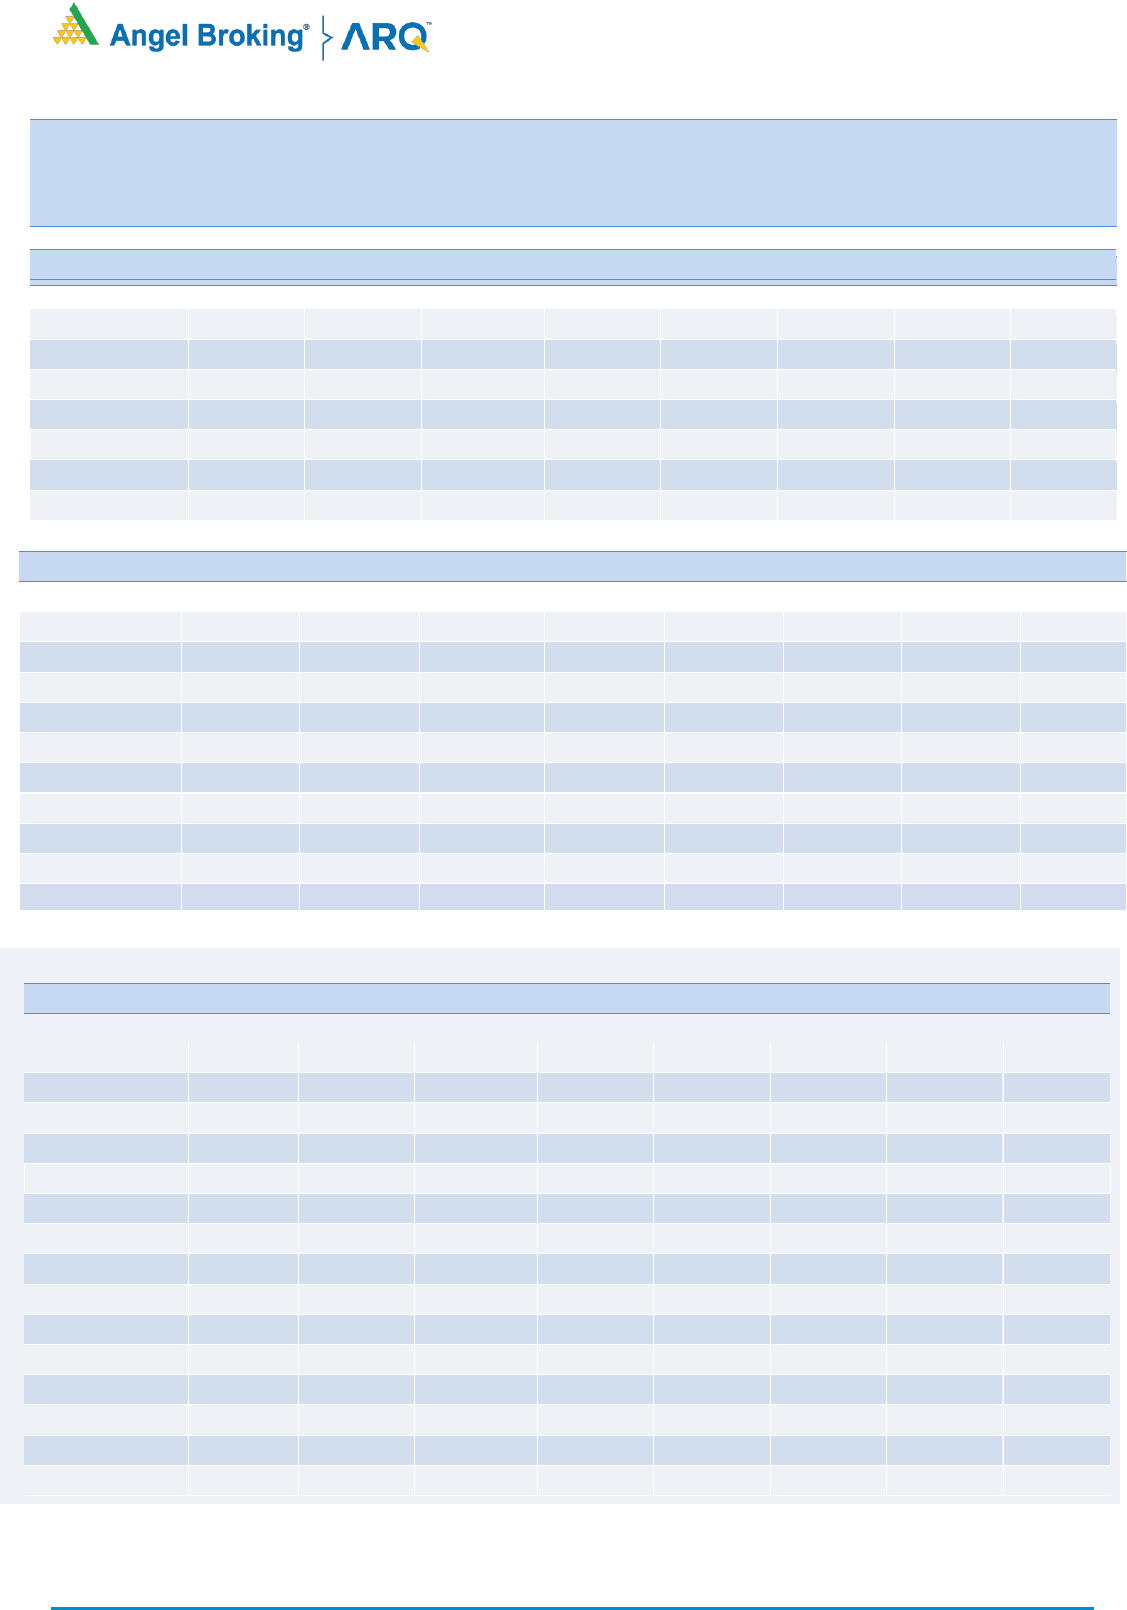
Monthly Gainers
Scrip
Price
Price
Change
(%)
Open
Interest
Ol
Change
(%)
BHEL
73.90
55.91
91402500
(4.11)
BANKBARODA
84.30
25.45
205428600
82.48
IOC
111.05
24.57
69829500
34.66
BALKRISIND
2205.45
24.40
1276000
(17.95)
COFORGE
3517.10
23.46
1131175
208.75
Note: Stocks which have more than 1000 contract in Futures OI.
Monthly Losers
Scrip
Price
Price
Change
(%)
Open
Interest
Ol
Change
(%)
JINDALSTEL
398.35
(12.81)
33255000
17.45
AUBANK
989.25
(11.76)
2613000
(9.37)
BANDHANBNK
297.20
(10.94)
21821400
39.71
TATACHEM
686.05
(10.62)
8403000
(0.63)
NAUKRI
4501.85
(10.41)
1412250
44.88
Note: Stocks which have more than 1000 contract in Futures OI.
It was yet another series wherein the Nifty maintained its positive posture. However, it wasn’t a smooth ride as we witnessed couple of
pull back moves mainly due to the nervousness seen in the global markets. Post some hiccups around 15000 mark, we finally saw a
sustainable move beyond this psychological levels in the mid of the series and then slowly extended the up move to almost touch the
15400 mark. This couldn’t have been possible without the late participation of banking index which was consolidating during the initial
two weeks of May series.
As far as F&O data is concerned, we witnessed decent longs formation during the series especially in the BankNifty. Rollover in Nifty and
BankNifty stood at 77% and 81%, respectively. These figures are above the three month averages which clearly suggest that the long
formed in May series have been rolled over. Recently, FIIs have been net buyers in equities but due to huge selling in first half of the
month they have turned net sellers of worth Rs. 9341 crores MoM. In F&O space too, they added bearish bets initially which resulted in
index futures ‘Long Short Ratio’ tanking below 50%. Fortunately, they halted selling once the global market looked stable and then
added meaningful longs along with covering of shorts. On the expiry day, they preferred carry forwarding longs and now the ‘Long Short
Ratio’ stands at 89%. Considering the above data point, we won’t be surprised to see Nifty entering the uncharted territory any time
soon. Hence, we maintain our positive stance on market and would advise trader’s to adopt buy on dips strategy until we manage to
sustain above 15000-15200 levels
Indices Change
INDEX
Price
Price
Change
(%)
Rollover
3 month
avg.
NIFTY
14894.90
3.98
66.28
75.40
BANKNIFTY
33714.50
2.15
64.60
76.84
FINNIFTY
16047.05
3.70
48.07
44.85
-
-
-
-
-
-
-
-
-
-
Derivatives Rollover Report
For Private Circulation Only
2
Scrip
Price
Price
Change
(%)
OI Futures
OI
Change
(%)
COC (%)
PCR-OI
Rollover
(%)
Average
Rollover
(3month)
(%)
AUTO & AUTO ANCILLARIES
AMARAJABAT
744.40
(7.64)
8371000
112.57
13.66
0.88
91.01
94.19
APOLLOTYRE
224.60
7.52
14322500
(1.63)
9.16
0.36
87.95
90.47
ASHOKLEY
127.15
9.80
30321000
(0.12)
8.66
0.54
93.07
87.70
BAJAJ-AUTO
4258.50
10.69
1665750
(14.08)
4.26
0.30
85.97
89.68
BALKRISIND
2205.45
24.40
1276000
(17.95)
8.29
0.24
84.89
90.42
BHARATFORG
685.85
12.85
7221000
15.31
6.63
0.37
95.19
94.57
BOSCHLTD
15122.55
10.95
119900
34.64
5.29
0.42
96.69
89.25
EICHERMOT
2621.80
5.87
2815400
5.84
9.95
0.42
95.43
94.00
ESCORTS
1152.80
1.77
4235000
53.97
12.13
0.71
97.99
94.09
EXIDEIND
189.65
6.19
13968000
1.84
6.18
0.56
96.78
92.36
HEROMOTOCO
3009.35
4.79
3561300
18.33
8.79
0.53
95.53
90.37
M&M
831.45
6.77
8339100
(16.77)
5.02
0.52
86.67
86.52
MARUTI
7017.50
6.29
2116300
(16.84)
10.19
0.48
95.27
92.06
MOTHERSUMI
234.85
6.34
28140000
(0.35)
10.96
0.73
96.86
92.91
MRF
83227.85
6.75
40460
6.22
7.62
0.39
91.41
88.32
TATAMOTORS
320.55
5.60
94634250
1.42
8.94
0.53
92.97
93.52
AMARAJABAT
744.40
(7.64)
8371000
112.57
13.66
0.88
91.01
94.19
BANKING & FINANCIALS
AXISBANK
754.25
4.51
38506800
(1.93)
7.59
0.70
92.18
88.90
BAJAJFINSV
11946.30
6.43
747850
(13.71)
7.08
0.54
94.43
92.65
BAJFINANCE
5712.60
3.98
3787375
0.04
7.81
0.39
96.50
93.50
BANKBARODA
84.30
25.45
205428600
82.48
13.11
0.59
95.55
86.11
CANBK
155.45
10.80
41666400
(31.11)
17.10
0.62
85.49
92.45
CHOLAFIN
539.35
(8.77)
11063750
173.52
4.21
0.49
94.77
91.18
FEDERALBNK
88.70
13.94
66200000
13.03
10.78
0.64
93.40
93.18
HDFC
2504.05
(1.96)
17671500
23.58
-2.79
0.49
95.91
92.97
HDFCBANK
1493.00
1.44
25425400
24.24
10.24
0.65
96.27
89.81
IBULHSGFIN
218.50
19.40
24821700
6.48
-46.26
0.49
88.11
89.37
ICICIBANK
656.70
5.48
68029500
(9.69)
9.96
0.66
90.83
91.42
ICICIPRULI
531.50
0.82
6619500
(6.66)
11.49
0.36
96.61
90.73
INDUSINDBK
1012.25
7.38
15857100
(16.18)
7.83
0.93
76.59
87.71
KOTAKBANK
1789.15
(1.20)
13194400
24.16
9.78
0.64
96.00
90.95
L&TFH
89.15
(1.05)
51571796
52.28
10.72
0.62
94.72
90.28
LICHSGFIN
454.15
9.98
5534000
12.75
10.85
0.55
91.96
90.01
M&MFIN
155.80
(5.92)
41104000
142.24
12.28
0.68
96.50
89.55
MANAPPURAM
154.70
4.60
30312000
31.60
4.73
0.39
97.66
92.08
MFSL
950.10
3.14
2053350
3.44
10.84
0.34
98.78
93.63
Derivatives Rollover Report
For Private Circulation Only
3
Scrip
Price
Price
Change
(%)
OI Futures
OI
Change
(%)
COC (%)
PCR-OI
Rollover
(%)
Average
Rollover
(3month)
(%)
MUTHOOTFIN
1250.45
6.70
2404500
(13.05)
7.39
0.83
95.70
92.19
PFC
118.15
9.60
36797000
18.96
13.09
0.66
95.82
89.79
PNB
42.55
20.71
296560000
67.72
13.86
0.71
86.82
83.74
RBLBANK
212.05
11.37
21222200
(3.49)
6.92
0.70
92.56
89.59
RECLTD
143.50
11.63
14562000
(7.75)
6.64
0.67
95.40
84.48
SBIN
423.65
17.45
100158000
7.54
-5.32
0.73
87.80
90.77
SRTRANSFIN
1441.25
1.23
2942400
(27.24)
-0.15
0.74
94.42
89.84
CAPITAL GOODS & INFRASTRUCTURE
ADANIPORTS
757.50
0.82
71881250
0.09
11.85
0.64
98.80
96.66
BHEL
73.90
55.91
91402500
(4.11)
11.95
0.72
90.43
91.20
GMRINFRA
27.00
18.42
88402500
(40.13)
10.90
0.30
94.97
88.35
HAVELLS
1021.90
0.66
3480000
(22.94)
3.01
0.39
93.69
93.43
LT
1491.15
9.15
12918525
(9.35)
8.17
0.56
95.51
93.78
SIEMENS
2058.50
8.96
823075
(9.14)
10.57
0.21
80.57
87.82
CEMENT
ACC
2014.05
6.94
2204500
(9.73)
10.11
0.53
92.94
89.65
AMBUJACEM
331.55
5.49
16581000
(10.32)
6.41
0.25
96.37
94.29
GRASIM
1427.80
5.45
13585000
(0.56)
10.97
0.40
89.86
84.60
RAMCOCEM
963.90
(2.54)
2288200
28.50
6.47
0.18
98.97
93.95
SHREECEM
28229.25
(1.32)
149125
(3.26)
8.48
0.16
90.68
91.43
CHEMICAL & FERTILIZERS
PIDILITIND
541.95
(5.51)
851000
35.73
8.05
0.33
74.71
71.65
TATACHEM
434.45
4.36
4853200
9.42
8.35
0.78
91.19
91.58
UPL
433.55
(9.37)
8288000
39.98
7.63
0.66
88.39
86.74
ASIANPAINT
738.55
3.97
5346500
1.00
14.06
0.46
84.48
81.93
COLPAL
1773.00
(6.01)
898875
4.81
12.04
0.18
86.06
85.08
DABUR
231.25
(5.80)
1755000
(51.71)
12.65
0.37
66.43
77.82
HINDUNILVR
764.40
(3.76)
5360500
5.81
9.91
0.58
83.78
75.77
ITC
376.00
3.50
30792000
13.77
12.56
0.55
83.76
72.37
JUBLFOOD
1360.60
(6.59)
2033750
4.13
-0.37
1.93
93.04
90.97
MCDOWELL-N
2368.50
(0.87)
4327875
(46.85)
6.97
0.56
76.88
71.90
MCLEODRUSS
282.55
8.38
2770000
(12.31)
4.92
0.75
76.63
89.24
TATAGLOBAL
140.95
(0.56)
18010000
(4.40)
10.35
0.56
92.05
89.07
TATAGLOBAL
149.45
(9.81)
16578000
156.63
15.89
0.33
88.97
86.06
TITAN
229.85
(14.33)
9764000
29.36
14.91
0.29
87.81
86.96
UBL
806.05
(13.71)
419500
419.50
15.46
0.00
76.59
-
CHEMICALS & FERTILIZERS
PIDILITIND
2104.30
13.13
2638500
42.93
4.77
0.87
96.12
95.17
TATACHEM
686.05
(10.62)
8403000
(0.63)
-12.03
0.55
94.62
91.79
CONCOR
556.00
(5.86)
7139784
40.51
7.43
0.32
99.05
94.03
CUMMINSIND
550.20
0.79
1871300
(0.55)
6.91
1.39
96.43
95.05
INDIGO
1441.15
(1.56)
2830800
(7.14)
6.91
0.68
96.45
88.50
JUSTDIAL
571.85
(3.36)
2202200
(17.90)
6.64
1.59
89.27
88.23
OIL & GAS
BPCL
512.45
(3.06)
26031600
34.02
6.26
0.65
98.66
93.25
GAIL
126.10
(8.19)
52849272
23.11
3.11
0.47
95.27
94.36
HINDPETRO
291.40
(10.71)
21789600
10.47
3.14
1.25
98.39
91.80
IGL
414.05
5.24
5249750
94.60
6.80
0.67
93.03
92.90
IOC
130.35
(11.05)
29414500
7.58
-21.64
0.69
75.14
76.55
MGL
1049.30
2.41
2084400
58.49
7.62
0.66
98.69
98.56
OIL
156.75
(8.71)
5095101
(42.46)
5.85
0.43
58.46
84.21
ONGC
133.25
(4.48)
26349050
38.04
0.98
0.46
82.71
71.60
Consumer Goods & FMCG
ASIANPAINT
2950.70
12.48
4509000
18.81
0.67
0.74
94.50
91.82
BERGEPAINT
801.70
11.72
4200900
43.84
6.22
0.27
95.05
93.30
BRITANNIA
3434.60
(0.52)
1886400
2.08
8.51
0.96
96.32
88.67
COLPAL
1691.60
13.54
2843050
(21.62)
5.85
0.24
97.21
95.76
CONCOR
556.00
(5.86)
7139784
40.51
7.43
0.32
99.05
94.03
CUMMINSIND
550.20
0.79
1871300
(0.55)
6.91
1.39
96.43
95.05
INDIGO
1441.15
(1.56)
2830800
(7.14)
6.91
0.68
96.45
88.50
JUSTDIAL
571.85
(3.36)
2202200
(17.90)
6.64
1.59
89.27
88.23
OIL & GAS
BPCL
512.45
(3.06)
26031600
34.02
6.26
0.65
98.66
93.25
Derivatives Rollover Report
For Private Circulation Only
4
Scrip
Price
Price
Change
(%)
OI Futures
OI
Change
(%)
COC (%)
PCR-OI
Rollover
(%)
Average
Rollover
(3month)
(%)
DABUR
530.40
(2.36)
11246250
(1.35)
8.86
0.56
95.28
95.18
GODREJCP
838.15
19.14
4935000
23.59
11.94
0.39
93.18
88.22
97.08
HINDUNILVR
2326.95
(3.93)
6909000
0.30
0.35
0.95
96.50
91.32
98.06
ITC
210.40
2.86
147283200
49.95
-5.19
0.55
89.34
86.99
96.24
JUBLFOOD
3117.30
5.61
1252250
(2.78)
9.90
0.31
96.87
92.50
97.07
MARICO
475.60
15.35
7902000
9.81
7.56
0.35
95.48
94.90
96.04
MCDOWELL-N
606.20
14.76
11272500
(14.83)
9.70
0.51
91.57
94.25
NESTLEIND
17827.20
7.40
235450
(21.58)
6.61
0.59
92.55
89.01
95.18
TATACONSUM
647.50
(3.95)
6732450
1.59
-2.36
0.62
96.44
75.96
97.08
DABUR
530.40
(2.36)
11246250
(1.35)
8.86
0.56
95.28
95.18
98.06
GODREJCP
838.15
19.14
4935000
23.59
11.94
0.39
93.18
88.22
96.24
MEDIA
DISHTV
13.35
(11.88)
95013000
(6.31)
14.81
0.46
93.85
92.83
PVR
1828.55
1.92
865200
(20.59)
5.15
0.62
91.34
88.69
SUNTV
448.35
(8.42)
3636000
30.53
9.22
1.64
92.03
90.57
ZEEL
298.80
(4.38)
27648800
(9.61)
6.58
0.84
91.85
83.77
COALINDIA
293.80
1.71
14714400
2
9
.
8
0
8.26
0.35
63.04
65.79
HINDALCO
88.10
30.23
34330000
(
1
3
.
3
6
)
2.22
0.61
78.46
82.59
HINDZINC
182.40
10.61
3964800
1
0
8
.
5
9
-8.52
0.34
71.17
74.01
JINDALSTEL
60.45
11.12
32228000
(
9
.
0
1
)
4.33
0.32
80.34
78.99
JSWSTEEL
(
1
9
.
0
METALS & MINING
COALINDIA
145.35
12.98
49035000
38.44
8.08
0.50
92.44
84.66
HINDALCO
387.95
3.61
27365200
(21.48)
7.95
0.61
93.53
89.78
JINDALSTEL
398.35
(12.81)
33255000
17.45
12.94
0.55
94.65
92.15
JSWSTEEL
687.15
(5.78)
34418250
2.48
11.35
0.95
91.13
91.72
NATIONALUM
74.40
14.29
81855000
(4.14)
11.87
0.77
95.80
94.12
NMDC
179.90
16.06
59911400
35.22
11.04
0.65
91.52
84.66
SAIL
123.30
8.87
153026000
48.82
12.54
0.62
90.49
86.21
TATASTEEL
1081.30
4.24
44104800
(8.94)
-20.44
0.59
96.23
93.05
VEDL
269.85
5.16
124660300
84.89
11.73
0.64
95.89
74.74
Media
PVR
1293.00
9.54
1435489
(14.46)
5.38
0.78
86.74
82.27
SUNTV
545.15
4.29
13707000
0.65
8.76
0.43
98.92
96.33
ZEEL
211.85
12.99
87225000
36.76
14.62
0.70
98.17
96.73
TEXTILES
ARVIND
66.40
(15.36)
5862000
(11.53)
5.92
1.09
82.52
89.16
CENTURYTEX
959.75
(7.62)
3744000
5.98
-1.70
0.81
98.89
99.06
PAGEIND
20491.75
6.10
156325
9.82
-9.51
0
96.19
89.39
RAYMOND
739.95
(13.35)
2732800
4.75
7.00
1.38
97.21
96.63
SRF
3044.00
4.24
923500
9.81
8.82
0.56
95.08
96.97
INFORMATION TECHNOLOGY
HCLTECH
948.00
3.62
21199500
(2.97)
8.68
0.73
97.33
94.44
INFY
1397.50
2.70
30925200
10.59
-4.95
0.65
97.48
92.64
MINDTREE
2320.85
10.16
1824800
27.08
6.70
0.35
96.02
84.05
COFORGE
3517.10
23.46
1131175
208.75
8.87
0.17
84.41
80.14
TCS
3204.35
2.42
6739200
16.39
11.18
0.72
97.15
90.42
TECHM
1026.90
4.68
10338600
(1.50)
10.16
0.81
96.36
93.50
WIPRO
540.60
10.08
34116800
20.21
-0.81
0.70
96.84
87.62
TELECOM
BHARTIARTL
350.55
0.39
34602594
(4.18)
7.10
0.90
89.38
87.82
IDEA
12.45
(7.43)
363300000
(10.52)
10.56
0.83
82.76
85.28
INFRATEL
276.95
1.58
6836000
3.14
10.20
0.49
84.58
83.89
TEXTILES
ARVIND
66.40
(15.36)
5862000
(11.53)
5.92
1.09
82.52
89.16
CENTURYTEX
959.75
(7.62)
3744000
5.98
-1.70
0.81
98.89
99.06
PAGEIND
20491.75
6.10
156325
9.82
-9.51
0
96.19
89.39
RAYMOND
739.95
(13.35)
2732800
4.75
7.00
1.38
97.21
96.63
SRF
3044.00
4.24
923500
9.81
8.82
0.56
95.08
96.97
MEDIA
DISHTV
31.30
(14.36)
79358000
36.60
10.50
0.80
90.60
90.38
PVR
1761.85
2.35
686000
(1.21)
-9.55
0.77
94.75
94.46
SUNTV
549.00
(5.52)
6148000
(0.26)
8.72
0.63
92.24
91.73
TV18BRDCST
29.25
(12.56)
44369000
(32.71)
2.23
0.44
94.15
94.99
ZEEL
367.90
(12.44)
20372300
18.63
9.46
0.47
97.35
90.61
Derivatives Rollover Report
For Private Circulation Only
5
Scrip
Price
Price
Change
(%)
OI Futures
OI
Change
(%)
COC (%)
PCR-OI
Rollover
(%)
Average
Rollover
(3month)
(%)
INFORMATION TECHNOLOGY
HCLTECH
564.00
(0.70)
22885800
(1.26)
8.14
0.58
98.56
96.78
INFY
730.55
3.77
24351600
(52.50)
2.86
0.74
55.98
79.52
MINDTREE
782.95
10.93
1041600
(14.29)
-15.63
0.59
93.13
93.37
NIITTECH
1606.65
6.68
578250
26.08
-2.03
0.46
89.76
82.99
TCS
2212.80
6.19
15671500
(17.22)
6.42
1.91
95.02
94.74
TECHM
775.75
1.00
15406800
8.21
9.05
0.65
96.29
97.15
WIPRO
249.90
3.65
18211200
(29.64)
-2.08
0.72
83.12
92.60
MISCELLANIOUS
ADANIENT
1329.35
11.75
18984000
31.74
3.91
1.02
93.49
88.22
APOLLOHOSP
3211.20
(1.22)
1746750
(5.07)
5.59
0.80
91.68
90.21
BATAINDIA
1558.55
14.93
850300
(32.13)
11.85
0.31
83.93
86.95
BEL
149.00
14.09
38634600
27.57
4.42
0.46
96.31
89.50
CONCOR
671.10
19.66
7780614
42.19
7.43
0.40
93.41
91.32
CUMMINSIND
778.00
(9.69)
2682600
153.75
11.82
0.54
96.50
89.37
INDIGO
1741.65
5.71
3449000
(6.26)
0.80
0.25
89.35
87.40
OIL & GAS
BPCL
470.70
11.69
44681400
8.98
8.89
0.51
93.84
91.32
GAIL
153.80
13.67
31988400
5.05
9.55
0.53
77.44
71.10
HINDPETRO
282.45
22.27
25501500
17.69
10.67
0.78
90.56
90.46
IGL
520.95
2.52
6111875
54.39
10.44
0.71
96.93
91.10
IOC
111.05
24.57
69829500
34.66
10.59
0.53
91.34
88.78
MGL
1215.15
10.04
1613400
19.62
5.31
0.45
97.18
94.35
ONGC
112.65
7.70
45345300
39.22
10.44
0.35
89.89
87.44
PETRONET
241.10
1.97
16596000
2.98
9.75
0.54
98.57
94.45
RELIANCE
1984.85
(2.19)
28872500
7.68
6.46
0.44
93.87
93.81
BPCL
470.70
11.69
44681400
8.98
8.89
0.51
93.84
91.32
BATAINDIA
1444.10
8.68
1488850
(10.54)
-2.88
0.42
93.06
94.61
BEL
115.85
1.49
22602000
(2.49)
10.21
0.44
97.34
96.42
MCX
659.60
(6.88)
2102100
(7.23)
11.16
0.79
93.26
90.88
MCX
1111.60
2.65
1348000
12.33
-3.27
0.66
92.87
80.54
PHARMACEUTICAL
AUROPHARMA
1037.15
6.60
8765250
(5.00)
7.85
0.51
97.81
95.86
BIOCON
383.45
(3.23)
17434000
0.03
5.93
0.71
86.18
89.52
CADILAHC
629.55
11.44
22301400
43.30
6.29
0.51
95.72
93.45
CIPLA
946.80
3.82
10505950
(19.23)
6.89
0.53
91.10
89.74
DIVISLAB
4112.60
4.73
2335400
(0.49)
11.94
0.71
91.35
92.40
DRREDDY
5299.45
3.34
2666250
(12.33)
8.48
1.16
90.40
91.56
GLENMARK
611.45
7.33
8406500
11.13
11.67
0.54
94.07
89.81
LUPIN
1209.10
14.22
7215650
(14.70)
6.98
0.66
87.26
88.15
PEL
1816.60
7.07
3435300
1.18
6.62
0.42
96.40
95.29
SUNPHARMA
703.65
8.63
45837400
15.91
8.66
0.57
95.43
95.62
TORNTPHARM
2716.20
8.30
824750
(16.12)
-1.64
0.38
93.64
94.01
AUROPHARMA
1037.15
6.60
8765250
(5.00)
7.85
0.51
97.81
95.86
BIOCON
383.45
(3.23)
17434000
0.03
5.93
0.71
86.18
89.52
CADILAHC
629.55
11.44
22301400
43.30
6.29
0.51
95.72
93.45
CIPLA
946.80
3.82
10505950
(19.23)
6.89
0.53
91.10
89.74
OIL & GAS
BPCL
512.45
(3.06)
26031600
34.02
6.26
0.65
98.66
93.25
GAIL
126.10
(8.19)
52849272
23.11
3.11
0.47
95.27
94.36
HINDPETRO
291.40
(10.71)
21789600
10.47
3.14
1.25
98.39
91.80
Derivatives Rollover Report
For Private Circulation Only
6
Scrip
Price
Price
Change
(%)
OI Futures
OI
Change
(%)
COC (%)
PCR-OI
Rollover
(%)
Average
Rollover
(3month)
(%)
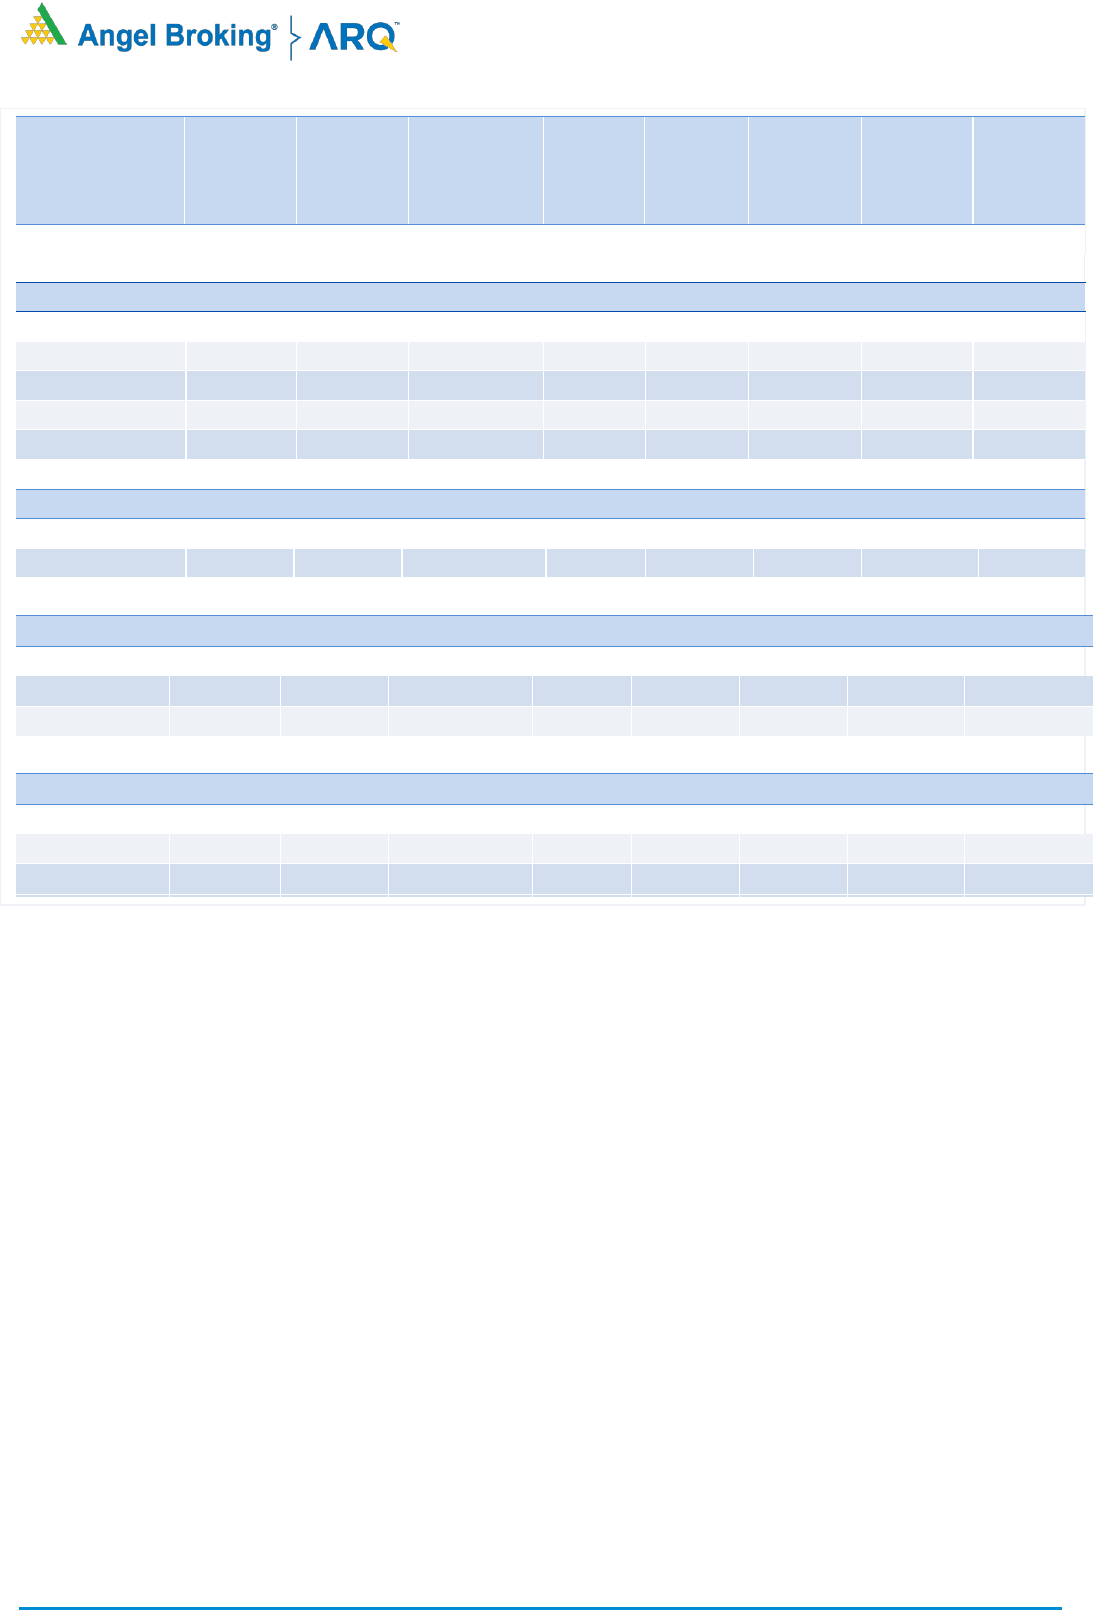
POWER
NTPC
110.95
7.15
64940100
(4.39)
8.60
0.44
82.26
86.75
POWERGRID
229.05
3.74
16448000
(13.23)
4.80
0.57
87.41
73.60
TATAPOWER
105.40
7.22
133157250
11.13
-13.04
0.47
97.48
95.72
TORNTPOWER
427.10
7.60
2008500
4.12
-9.51
0.30
91.59
90.29
REAL ESTATE
DLF
285.15
14.04
29102700
(1.38)
9.02
0.53
96.12
93.78
TELECOM
BHARTIARTL
523.90
(3.51)
115041501
23.00
11.52
0.73
97.97
95.78
IDEA
8.50
0.59
582960000
(6.28)
8.64
0.46
85.39
73.89
TEXTILES
PAGEIND
32025.90
6.54
93510
44.17
11.96
0.28
98.51
95.74
SRF
6544.35
1.24
338625
(19.35)
10.10
0.39
95.45
92.34
CENTURYTEX
487.95
4.96
3472200
3.19
9.28
0.26
98.91
84.95
PAGEIND
22340.05
0.42
115325
(20.02)
3.23
0.00
90.77
89.33
POWER
ADANIPOWER
51.75
(0.38)
131920000
(3.16)
6.33
0.68
98.37
95.34
CESC
788.45
5.04
1217600
(14.52)
10.16
0.05
96.98
94.18
NTPC
140.85
3.57
63643200
46.15
6.51
0.42
74.18
71.71
POWERGRID
208.95
8.77
31196000
46.96
7.85
0.98
86.83
81.73
TATAPOWER
69.25
(0.22)
53307000
(2.47)
11.39
0.95
92.66
92.57
TORNTPOWER
280.50
13.36
4017000
90.20
-26.19
1.31
84.48
88.46

Derivatives Rollover Report
For Private Circulation Only
7
Technical and Derivatives Team:
Sameet Chavan Chief Analyst - Technical & Derivatives sameet.chavan@angelbroking.com
Ruchit Jain Senior Analyst - Technical & Derivatives ruchit.jain@angelbroking.com
Rajesh Bhosale Technical Analyst rajesh.bhosle@angelbroking.com
Research Team Tel: 022 - 39357600 (EXTN - 6844) Website: www.angelbroking.com
For Technical & Derivative Queries E-mail: technicalresearch-cso@angelbroking.com
DISCLAIMER
Angel Broking Limited (hereinafter referred to as “Angel”) is a registered Member of National Stock Exchange of India Limited,
Bombay Stock Exchange Limited and Metropolitan Stock Exchange Limited. It is also registered as a Depository Participant with
CDSL and Portfolio Manager and Investment Adviser with SEBI. It also has registration with AMFI as a Mutual Fund Distributor.
Angel Broking Limited is a registered entity with SEBI for Research Analyst in terms of SEBI (Research Analyst) Regulations, 2014
vide registration number INH000000164. Angel or its associates has not been debarred/ suspended by SEBI or any other regulatory
authority for accessing /dealing in securities Market. Angel or its associates/analyst has not received any compensation / managed
or co-managed public offering of securities of the company covered by Analyst during the past twelve months.
This document is solely for the personal information of the recipient, and must not be singularly used as the basis of any
investment decision. Nothing in this document should be construed as investment or financial advice. Each recipient of this
document should make such investigations as they deem necessary to arrive at an independent evaluation of an investment in the
securities of the companies referred to in this document (including the merits and risks involved), and should consult their own
advisors to determine the merits and risks of such an investment.
Reports based on technical and derivative analysis center on studying charts of a stock's price movement, outstanding positions
and trading volume, as opposed to focusing on a company's fundamentals and, as such, may not match with a report on a
company's fundamentals. Investors are advised to refer the Fundamental and Technical Research Reports available on our website
to evaluate the contrary view, if any.
The information in this document has been printed on the basis of publicly available information, internal data and other reliable
sources believed to be true, but we do not represent that it is accurate or complete and it should not be relied on as such, as this
document is for general guidance only. Angel Broking Limited or any of its affiliates/ group companies shall not be in any way
responsible for any loss or damage that may arise to any person from any inadvertent error in the information contained in this
report. Angel Broking Limited has not independently verified all the information contained within this document. Accordingly, we
cannot testify, nor make any representation or warranty, express or implied, to the accuracy, contents or data contained within this
document. While Angel Broking Limited endeavors to update on a reasonable basis the information discussed in this material,
there may be regulatory, compliance, or other reasons that prevent us from doing so.
This document is being supplied to you solely for your information, and its contents, information or data may not be reproduced,
redistributed or passed on, directly or indirectly.
Neither Angel Broking Limited, nor its directors, employees or affiliates shall be liable for any loss or damage that may arise from or
in connection with the use of this information.
Derivative Research Team derivatives.desk@angelbroking.com
